FOR IMMEDIATE RELEASE

AUSTIN, TX – April 7, 2022 – Qvinci® Software has just released new enhanced drill-down functionality for the already acclaimed Advisory Portal and unveiled 9 additional Gallery Report Templates. Now, Qvinci customers have even more color-coded granular data and actionable insights available at the lightning-fast click of a mouse.
_
Enhanced Advisory Portal Drill-Down Functionality
The Advisory Portal, which uses color-coded predictive analytics to show performance trending (GREEN = Favorable / RED = Unfavorable), presents clients’/entities’ summary movement of Profit & Loss and Balance Sheet data over time (dynamic).
With Qvinci, the analysis and interpretation of the financial insights are simple.
(GREEN means you’re good and RED means “Uh oh, we need to talk!”)
This portal is the starting point for all Qvinci customers and is the navigational dashboard from which to change or filter Reporting Entities and Periods. Simply set your reporting period, click a cell, and review the Advisory Analysis Card or click again to go deeper.

 |
 (Click Image to Open Report Package) (Click Image to Open Report Package) |
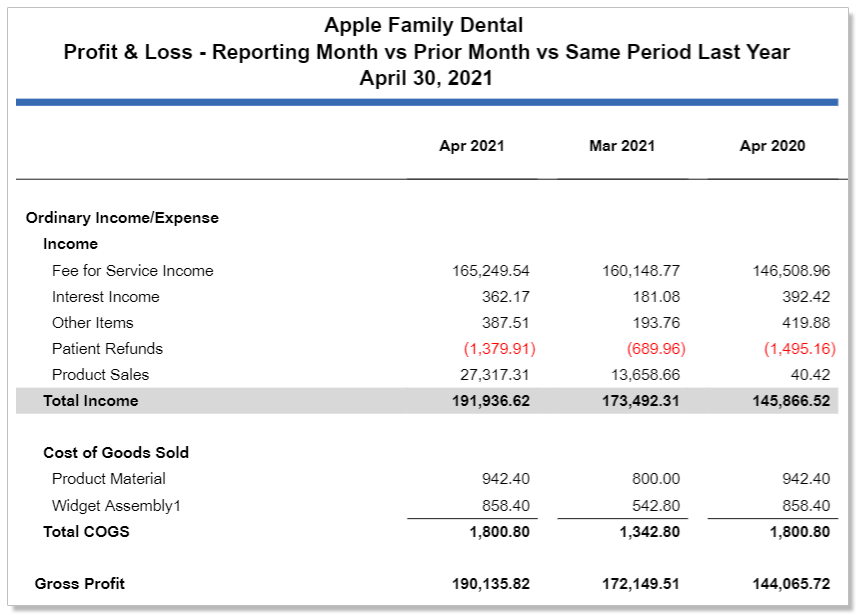
Drill Down to the Underlying Financial Reports
Drilling down to the underlying reports allows the user to review granular data on the specific issue being researched. Not only has Qvinci taken the mystery out of reading traditional financials for business owners and organizational decision makers by providing actionable financial insights everyone understands, but multiple layers can now be drilled through to further research relevant issues affecting your clients or your business. |
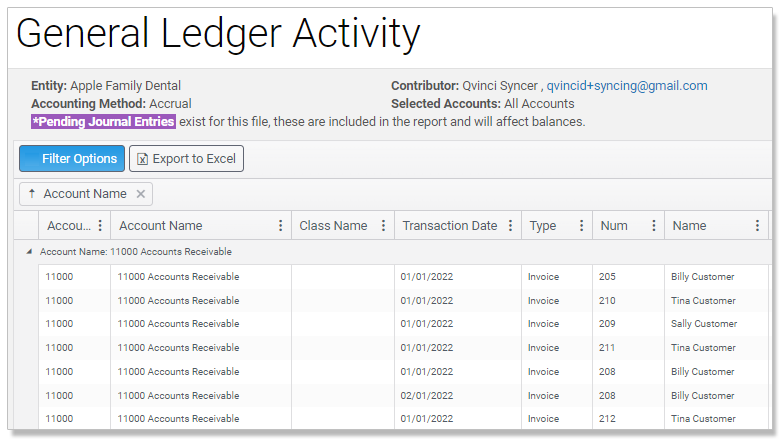
| Drill Down to the General Ledger
From the Advisory Portal, the user can further drill down to the General Ledger transactional activity, filter the General Ledger activities, and even export them to Excel. The user can also review pending journal entries and authorize or reject them (with appropriate permissions) right from the same screen. A user can also drill-down from any Gallery Report directly to the General Ledger activity associated with that report. |
 (Click image to expand) (Click image to expand) |
 (Click image to expand) (Click image to expand) |
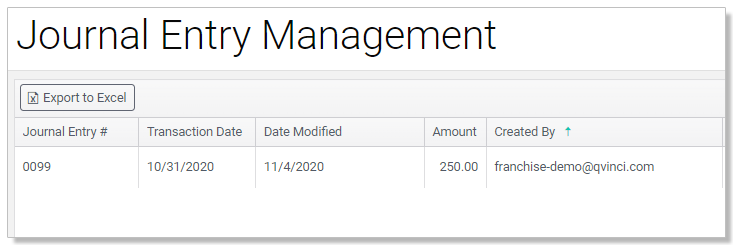
Drill Down to Journal Entry Management
Journal Entry management is at the tips of your fingers with Qvinci’s Advisory Portal. The User can create, review, and approve (with appropriate permissions) journal entries and manage the entire process directly from the Advisory Portal. The User can also toggle back to the General Ledger from the Journal Entry page. This type of Journal Entry Management through a layer approval process is not currently available in QuickBooks. |
Please Note: The drilldown from the Advisory Portal to the underlying Financial Reports applies to all customers at Qvinci. The drilldown to the General Ledger and Journal Entry Management are optional upgrades that can be purchased separately. The General Ledger and Journal Entry functionality only applies to QuickBooks desktop and online accounting files. If your subscription does not include the General Ledger or Journal Entry features, please see Customer Success or your Solution Consultant.
↑
In sum, on Qvinci’s Advisory Portal, with 4 quick clicks of a mouse, users can now…
-
- Choose the desired reporting period and review the data directly in the Advisory Portal
- Click any desired cell and drill down to the Advisory Analysis Card to review more data
- Drill down even further into underlying financial reports for the next level of granular data
- Drill down to the most granular data at the transactional level in the General Ledger and Journal Entries
|
New Automated KPI Ratio and Scorecard Report Templates
Qvinci has also released 9 new automated gallery report templates (Free to all Qvinci Users) that are ultra-useful and packed with Key Performance Indicators that empower business owners and field managers to make impactful, informed decisions. Information is power, and these reports provide tons of information that’s quickly accessible, simple to read, and easy to implement.
| Automated KPI Scorecard with Benchmarking  (Click image to expand) (Click image to expand) |
Automated KPI Scorecard without Benchmarking 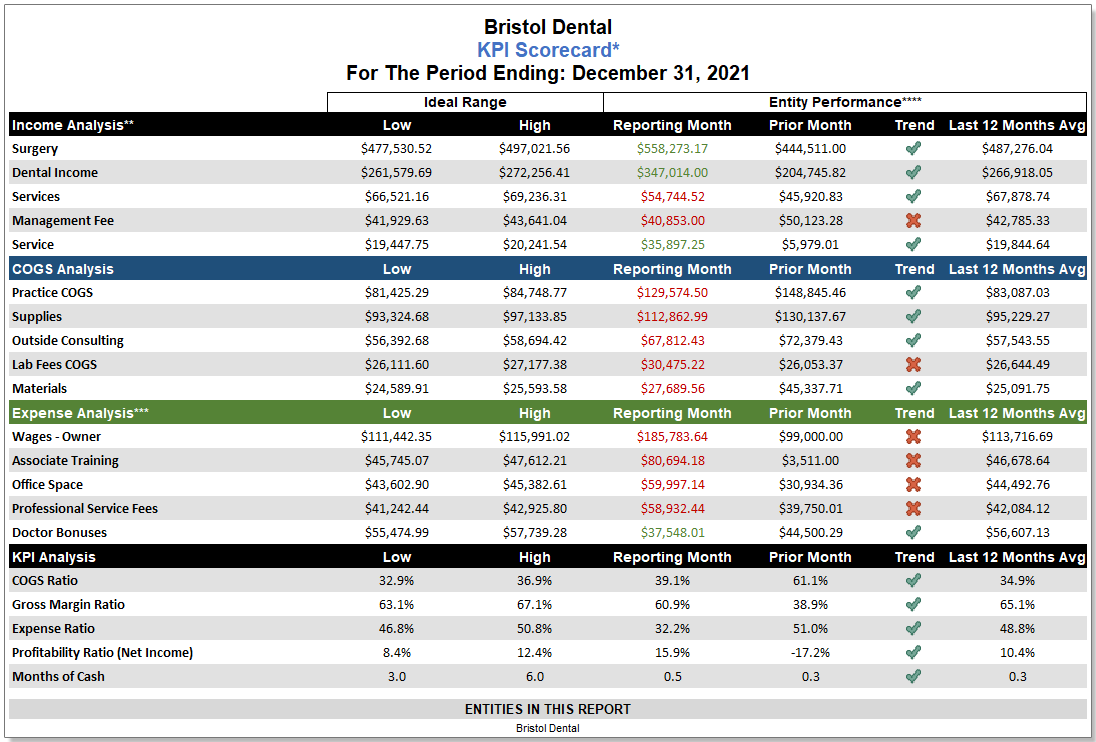 (Click image to expand) (Click image to expand) |
 |
|
These new reports – KPI Ratios (click HERE for example), KPI Scorecard with Benchmarking (click HERE for example), and KPI Scorecard without Benchmarking (click HERE for example) – are available in the following periods:
|
KPI Ratios (Click image to expand) (Click image to expand) |
|
Like all Qvinci solutions, the Advisory Portal, KPI Scorecard, KPI Ratios, Reporting Templates and Packages auto-update, auto-blend, auto-style, and auto-package virtually instantaneously. You’ll get answers like customizable KPIs, Cash position, P&L performance, Expense analysis, AR/AP, and many others with the click of a mouse!
Bonus: Create, Edit, Style, Package, Publish, and Template Reporting Packages
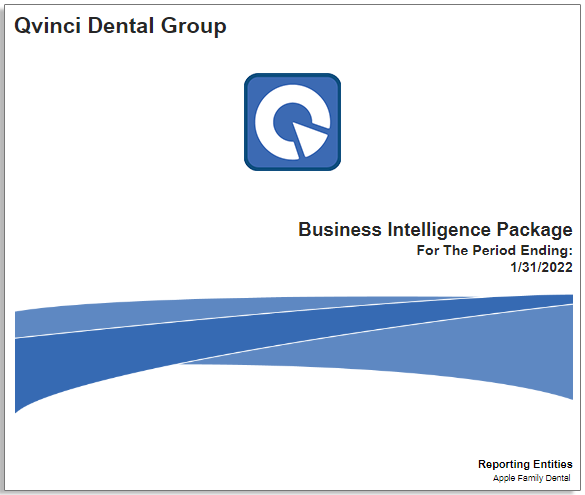
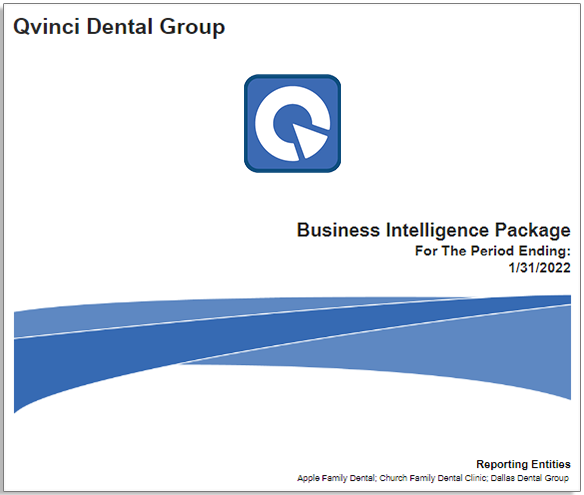
Qvinci also provides 100+ gallery report templates in the Jumpstart Gallery that can be used by customers free of charge as is or customized at will. With Qvinci, customers can also create, edit, style, package, and publish entire reporting packages, which include, among other things, business intelligence, financial reporting, cover pages, indexes, and disclosures, all designed to your exact specifications. The cover page below is completely customizable.
| Single-Entity Reporting Packages | Multi-Entity Reporting Packages |
Practical Application and Conclusion
The possibilities and opportunities are endless with Qvinci’s new drill-down features, gallery reporting, and packaging capabilities!
For Accountants: Imagine the consulting and advisory opportunities if you could review your client’s metrics from the Advisory Portal all the way down to the general ledger with a few clicks of a mouse and then walk your clients through their KPI Scorecard and consult with them regularly!
For Franchises: Imagine the collaborative and profitable relationship fostered between franchise operations and owners if you could review each franchise owner’s metrics on the Advisory Portal and then sit down with each one of them and review their KPI Ratios or Scorecard, with regularly scheduled progress checks.
For Dioceses: Imagine, in addition to the above, the benefit of consistently knowing your Advisory Portal and KPI Metrics on a rolling basis and having complete transparency into the financial status, health, and progress of each one of your dioceses, parishes, schools, churches, or other reporting entities.
 |
|
According to Qvinci’s Founder and Chief Innovation Officer, Charles Nagel, “KPI Ratios and KPI Scorecards provide an immediate view of the underlying data that is driving the metrics. The new drill-down capabilities of the Advisory Portal provide the flexibility to not only define the most important metrics to monitor, but also have those metrics at your fingertips.”
According to Qvinci’s CEO Brad Adams, “The new Advisory Portal, KPI Ratio, and KPI Scorecard upgrades are just the latest example of the type of business intelligence, predictive analytics, and forecast modeling tools Qvinci consistently delivers to its customers in line with its Vision, Mission, and Values: INNOVATION, EMPOWERMENT AND EXCELLENCE.”
NEW PRODUCT INTRODUCTION! To introduce these new features and functionality, Qvinci will host a Live Webinar on Wednesdays @ 12:00pm CT.
|


| John Logan Executive Vice President johnl@qvinci.com (512) 637-7337 x304 |
Charles Nagel Founder & CIO charlesn@qvinci.com (512) 637-7337 x300 |
Rob Dean Director of Customer Success robd@qvinci.com (512) 637-7337 x331 |

|
