Qvinci® Software just released its Spring 2025 new products and enhancements that empower franchises, dioceses, multi-entity organizations, and accounting professionals to streamline workflows and zero in on actionable financial insights that accelerate profitability and growth.
Qvinci’s cloud-based solution with ERP-like functionality solves the long-standing, time-consuming problems of multi-location data collection, consolidation, and mapping by automating the process. This provides business owners and business portfolio managers with a streamlined way to fast-track, standardize, report, and analyze color-coded financial data that’s easy to understand and act on.
The Spring 2025 releases deliver performance-focused enhancements that set the standard for innovation in multi-entity and multi-location financial management.
Releases include:
1) Report Categorization & Packaging – Libraries 2.0 is an upgraded way of building financial and business intelligence reporting packages.
- Significantly enhanced UX for selecting reports (with option of reverting to Libraries 1.0 per user preference).
- Bulk-pinning to eliminate redundant selections.
- Streamlined filtering of 220+ gallery templates.
- And more.
RESULT: Design and deliver accurate and timely report packages in just minutes.
Pin Selection:

The New Library UX features four drop-down filters to select your Report Category, Report Type, Date Range, and Account Mapping type. The results based on the selection are shown below the filters. Easily bulk-pin reports by checking the box to the above list of reports, and click “Pin Selected.”
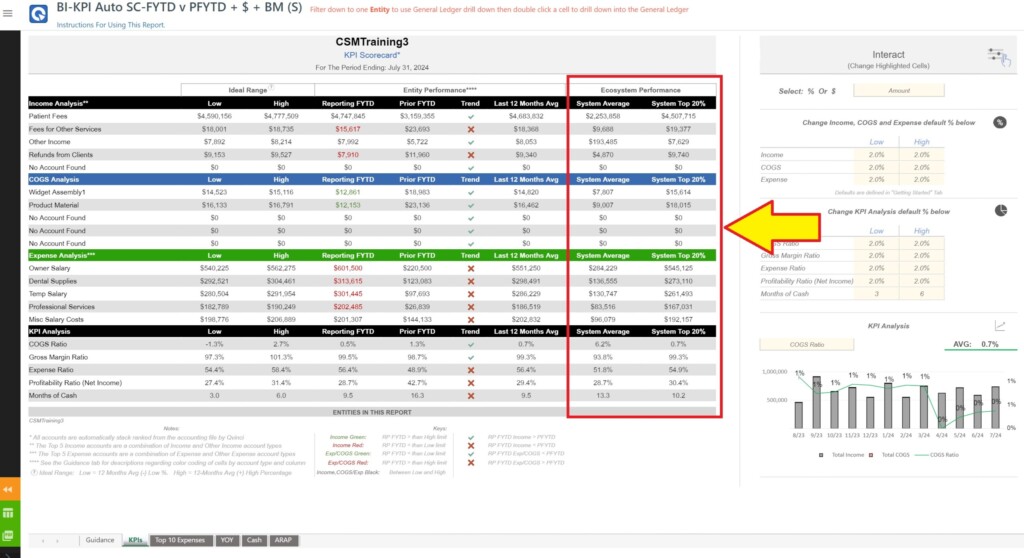
2) Report Interact – A dynamic addition to Qvinci’s business intelligence solution, the new interact feature provides a variety of dropdown lists and options that allow the user to customize reports with ease and gain a clearer understanding of your data by refining your investigation. This functionality transforms static data into interactive reports that enhance coaching and advisory.
- Switch from dollar values to percentages or different analysis perspectives, such as viewing entities at risk or identifying best performers.
- Simplify the review process by highlighting specific cells, drawing attention to critical issues.
- Apply filters per specific entity in multi-entity reports, enabling hyper-granular analysis.
- Toggle between reporting periods (i.e., FYTD, Reporting Month, Reporting 3 Months, and more).
- Display or hide specific chart elements based on your specific reporting needs.
- Bar charts visualize the distribution of income across entities for simplified comparison of percentage differences.
RESULT: Gain actionable insights and tailor reporting to meet specific needs without wasting valuable time re-running data again and again or switching between multiple reports.
BI-KPI Auto SC-FYTD v PFYTD + $ + BM (S):
3) New Reporting & Business Intelligence Templates – New and enhanced dashboards and scorecards focusing on key metrics and time periods for applicable financial analysis.
- Performance dashboards adapted to P&L GL Weekly data
- Big 4 and Top 10 dashboards with selectable periods
- Benchmarking and ranking dashboards adapted to P&L GL Weekly data
- KPI scorecards, including the new “Interact” features
- Breakeven and What If Analysis dashboards
- KPI scorecards adapted to P&L GL Weekly data
- Budget v Actual – FYTD
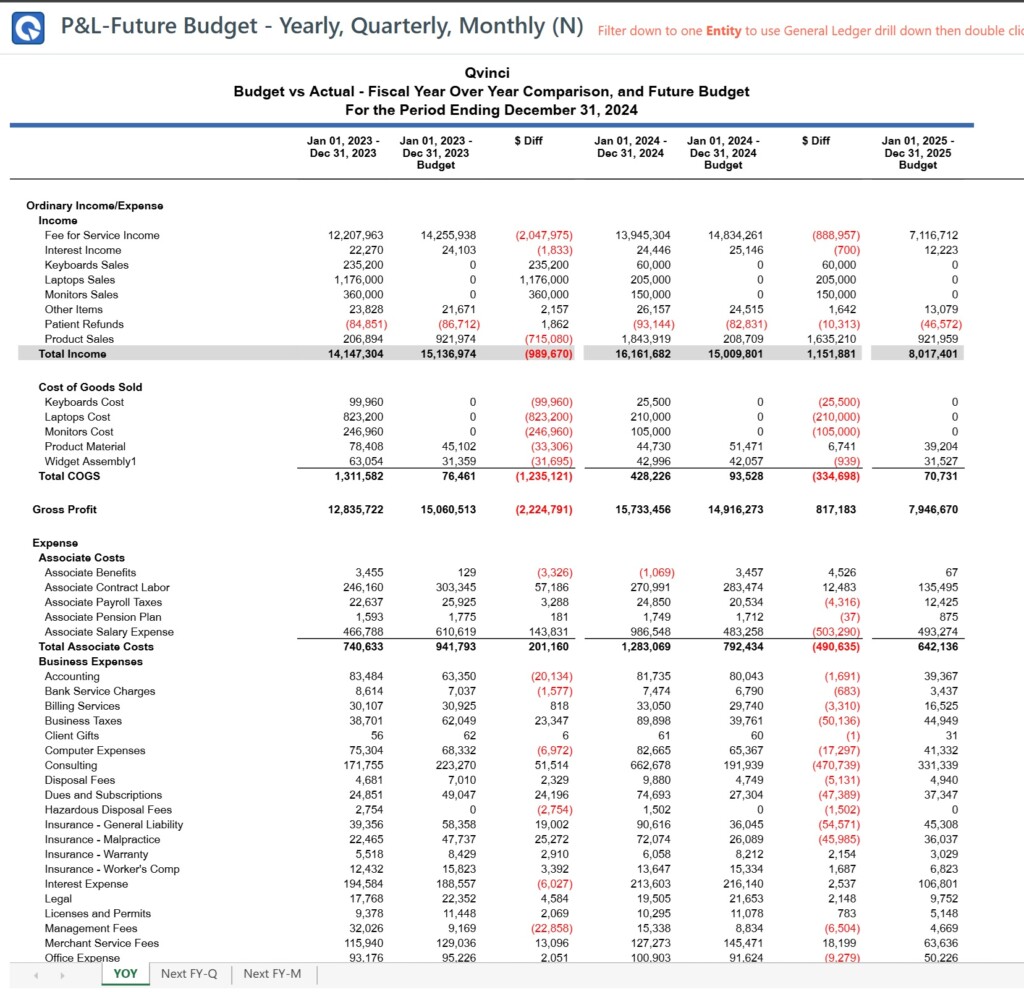
- P&L Future Budget – yearly, quarterly, monthly
- Entities at risk / Best performers dashboards
RESULT: Faster, smarter decision-making via color-coded financial dashboards that are super easy to understand and act on.
Breakeven Analysis:

“What If” Analysis:

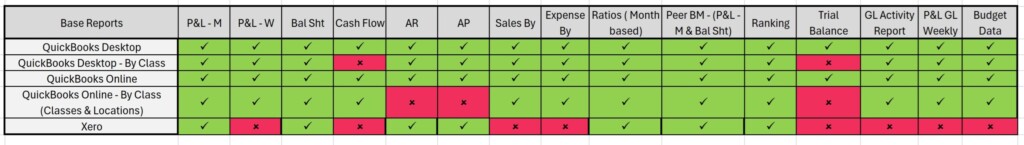
4) Currency Conversion Tools With Advanced Reporting and Business Intelligence – Generate multi-currency reports across QuickBooks Online, QuickBooks Desktop, and Xero with customizable conversion capabilities.
- Automatic, real-time conversions
- Exchange rates source from Xe.com
- Applied rates based on the transaction date
- Manual rate entry unsupported (ensures consistency and transparency)
- Conversions applied to the following reports:
- General Leger
- Profit & Loss (P&L)
- Balance Sheet
- Ranking and Ratio Reports (derived from P&L and Balance Sheet)
- Trial Balance
- Cash Flow
- Accounts Receivable (A/R) Aging Summary
- Accounts Payable (A/P) Aging Summary
- Sales by Customer
- Sales by Vendor
RESULT: Simplifies multi-entity global reporting without the headache and hassle of having to manually adjust currencies.
Currency Conversion Chart:
5) Qvinci Budgets Including Future Budgeting – Import Excel-based budgets to use with new templates like Actual + Budget + Variance.
- Enables customers to use Qvinci Budgets if they are using QuickBooks Desktop, QuickBooks Online, or QuickBooks by Class.
- The Qvinci Budget template accounts come from the customer’s QuickBooks Desktop / QuickBooks Online file.
- Only native accounts are tracked.
- “Next Fiscal Year” and “Next Calendar Year” date ranges allow for use in budget planning and are available in Profit and Loss Monthly basic reports and the P&L Monthly library template.
RESULT: Eliminates spreadsheet chaos and clunky workarounds while enabling precise financial planning.
P&L – Future Budget – Yearly, Quarterly, Monthly (N):
6) Non-Sunday Aligned Weekly Reporting With Custom Calendars – Use your organization’s or clients’ non-standard operational calendars to create “As of Week” reports (ideal for franchises, hospitality brands, faith-based institutions, and more).
- Enabled at Company/Client level.
- Set for any day of the week by customizing reporting periods with “As of Week” reporting.
- Customize your accounting calendar reporting structure to your specific needs, such as 4-4-5, 5-4-4, or even a 4-4-4 (or any combination), by-entity, or consolidated.
- Admin Portal user selects a start date, a calendar type (12 or 13 periods), and clicks “Update” to generate the “Accounting Calendar” that fuels all P&L GL Weekly frequencies.
- 38 new gallery reports to fit your operation’s busiest days of the week, whether you’re a faith-based org, franchise, or hospitality brand.
RESULT: Provide financial reports aligned with operational cycles for insightful location comparisons and performance tracking.
Running GL Non-Sunday Aligned Weekly Reporting From the Gallery Reports:
7) Infrastructure & Security Improvements – Qvinci now includes advanced protections:
- Awarded PCI certification
- Published security plan – “Qvinci Technology Due Diligence and Security Protocol Disclosures”
- Multi-factor authentication (MFA)
RESULT: Enterprise-grade security for extremely sensitive financial data (perfect for multi-entity/-location organizations and advisory firms).
Multi-Factor Authentication Enablement:

8) Eliminations Entries With No Need to Utilize Account Files – Avoid hopping between several files or managing duplicate data by doing intercompany eliminations directly within the Qvinci solution.
- Enabled at the Company/Client level.
- Admin, Leader, and Manager can create and approve/unapprove elimination entries.
- Users can filter down Elimination Entry Management page to display all elimination entries that include the entities selected.
- Elimination Entries can be exported to Excel via Elimination Entry Management > Export to Excel button. Full entry details are included in export.
- Elimination entries, when enabled, only effect P&L Monthly, Balance Sheet, and Cash Flow reports.
- 3 different eliminations reports with SCoA and native options.
- ELIM – Det – By Ent – RM (S and N version)
- ELIM – Det – By Ent – R3M (S and N version)
- ELIM – Det – By Ent – FYTD (S and N version)
- And more.
RESULT: By drastically cutting down on needless complexity and manual labor, this simplifies reporting for multi-entity/location enterprises.
Creating Eliminations: